
- Project Title: Automation of LC/MS Spectral Analysis for Anti-Doping Control
- External Partners: AFLD
- Keywords: data analysis, mass spectrometry
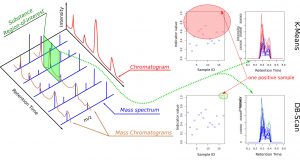
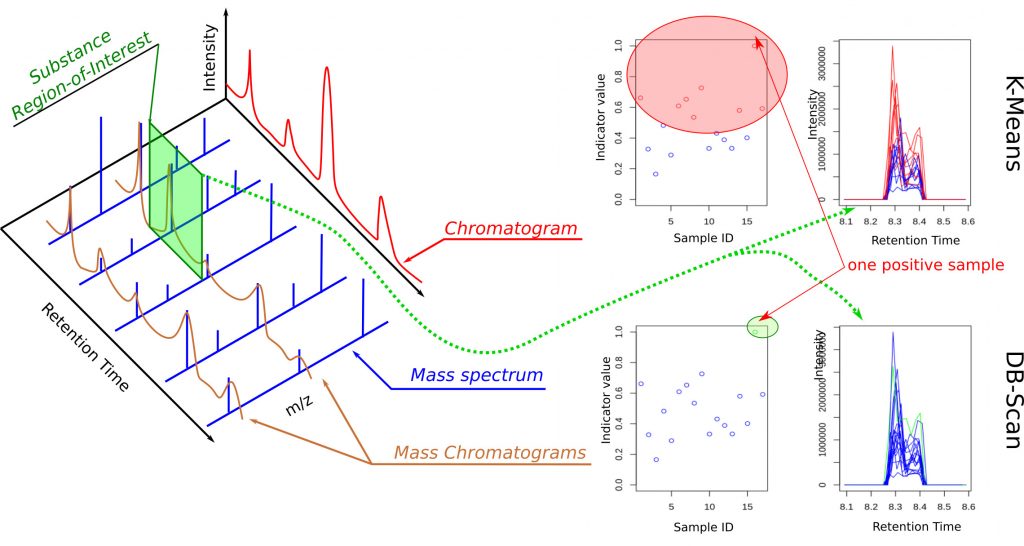
The fight against doping is truly at the heart of all states that wish to promote “clean” sport. The usual method for anti-doping control is liquid chromatography coupled with mass spectrometry (LC–MS) performed on athletes’ fluids (urine, blood). All retention times of chemical substances (liquid chromatography) and their masses (mass spectrometry) are scanned, which leads to the acquisition of large volumes of data—between 0.5 GB and 1 GB per athlete. Thus, for each athlete, two spectra are obtained (positive-ion spectrum and negative-ion spectrum) in three dimensions (retention time, m/z mass, and intensity) (Figure 1, left panel). Each substance is therefore located in a small region of interest in one of the two spectra and centered at specific coordinates (retention time, mass), within experimental drift. These regions of interest are like small windows associated with each of the more than 600 substances to be identified, such as the one illustrated in green in the spectrum shown in Figure 1.
The French Anti-Doping Agency (AFLD) traditionally performs a visual inspection consisting in comparing the amplitudes of peaks located at the expected coordinates for each substance with known thresholds previously characterized by the laboratory; the response is therefore binary: positive/negative for the presence of a doping agent. This step is time-consuming and requires extensive knowledge of substances and human metabolism. More generally, this threshold-comparison analysis method, which yields a binary result, does not make it easy to highlight suspicious profiles of doped athletes who nevertheless remain below the thresholds; in such situations, full investigations would be necessary.
The AFLD analysis department, CEA, and CNRS have joined forces to automate the detection of prohibited substances in athletes’ fluids in order to limit the risk of false negatives or false positives, but also to detect suspicious profiles of athletes who test negative.
Since this is essentially a classification problem, we chose to implement algorithms that generate a three-state output: positive/negative/doubtful. In production, this approach does not require expert intervention, except for the final regulatory validation. We worked on the entire three-dimensional spectrum of real samples provided by AFLD, and the data volume is therefore substantial. We thus had to develop a database management system to store the spectra and access them via simple SQL queries.
A priori, most samples from anti-doping controls are negative for prohibited substances because, on the one hand, many substances in the database are no longer used, and on the other hand, athletes have become extremely vigilant. It is therefore not possible to use them to test a classifier—which is a data-processing tool that automatically labels data—or to evaluate the performance of an approach. A generator was therefore developed to make samples artificially positive, thus enabling work with cohorts of virtual athletes who could have been doped with even improbable substances, while respecting the specific characteristics of mass spectrometry.
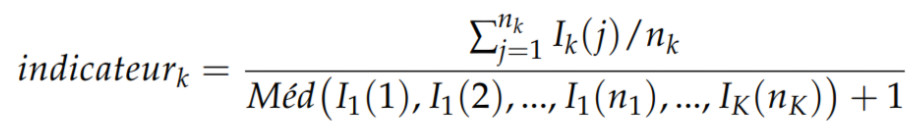
Classification methods on large data volumes require significant computational resources. For this reason, rather than injecting entire spectra of nearly one gigabyte—far too large—into one or more classifiers, we defined a mathematical indicator (Eq. 1) whose values serve as input data for the classifiers. It is defined as the ratio between the mean of a region of interest of the spectrum for a given substance and the median of the region of interest over all spectra associated with a sporting event. This makes it possible to obtain classification results quickly, since the data vectors are reduced to the extreme.
Several classification methods were considered, and we selected a combination of K-Means and DBScan (Figure 1, right panel) because, on the one hand, they do not require training in the strict sense, and on the other hand, they make it possible to group data into different classes. The first forces the creation of K classes, while the second is limited to two. Athletes for whom one or more indicators are too far from those of the other athletes are identified as suspicious. Moreover, these are standard tools available in several programming languages, which facilitates potential porting or technology transfer. Since the approach we propose searches for abnormal indicators (those that stand out) to detect doubtful cases, a bias is possible if all athletes are uniformly doped with the same substance. To avoid this bias, we extended the approach by mixing spectra associated with different athletes from different events. This reduces this possibility to almost zero, as confirmed by our tests on synthetic data.
The method was tested on real spectra from six campaigns of around thirty athletes each. The results obtained are consistent with the traditional method for doped athletes, with the additional identification of suspicious profiles. A specific database schema was designed, which is also of interest to other colleagues using mass spectrometry, such as the metabolite analysis laboratory or those searching for pesticides in food products. The algorithm exploits a mathematical indicator as well as classification algorithms. Experimental drifts are taken into account in order to combine spectra from different competitions. The technique has been transferred to the company Mesures-AD, which will offer an online service within a few months, with AFLD as the expected beta tester; it will be able to upload its anonymous spectra for testing.