When a liquid is cooled without crystallizing, its viscosity gradually increases to extreme levels as the dynamics slow down at the molecular scale. This phenomenon causes the formation of glasses, in which the dynamics are so slow that they remain indefinitely stuck in a non-equilibrium glassy state. This gives glasses the mechanical properties of a solid, even though their structure remains indistinguishable from that of a liquid.
While the existence of this glassy transition is now well established, establishing its exact nature and understanding the behavior of the associated dynamic quantities remain very active research topics. Using molecular dynamics simulations, researchers at SPEC/SPHYNX have demonstrated the links between the increase in activation energy driving diffusion, the average number of dynamically correlated molecules, and the maximum observed for 3rd-order susceptibility as the glass transition approaches.

Diffusion within many glassy materials follows a thermally activated dynamic, characterized by an activation energy Ea. When the thermal energy of the molecules becomes significantly lower than this energy barrier, it becomes difficult to cross it and the diffusion dynamic slows down. The slowdown in dynamics at the molecular scale, starting at picoseconds at high temperatures, then exceeds one minute at the glass transition temperature, where viscosity becomes of the order of 1012 to 1014 Pa.s In organic liquids, the dynamics are generally even more super-activated, with a greatly amplified slowdown due to an increase in activation energy as T decreases. While the physical mechanisms behind this phenomenon are still poorly understood, it is accompanied by an increase in spatial and temporal correlations in the movements of molecules, which could be a sign of “concerted” movements on the part of adjacent molecules or linked to the movement of a molecule that could facilitate the subsequent movement of its neighbors.
There are few experimental techniques available to address these questions. Among those developed at SPEC/SPHYNX over the past 20 years:
- One is nonlinear dielectric spectroscopy, the linear version of which is widely used to study the molecular dynamics of polar liquids. It consists of probing, by measuring electrical susceptibility c(ω), the response of a medium subjected to an alternating electric field (ω), which excites and allows tracking of the orientation of the dipole moment of the molecules.
- Another version consists of measuring the susceptibility in the presence of an intense static electric field.
In both cases, the nonlinear susceptibility terms, the first of which is of order 3 (χ(3)(ω) in an intense alternating field, or χ(2,1)(ω), a term linear in an oscillating field and quadratic in a static field) are very difficult to measure, but contain information about the cooperative dynamics of liquids. It is noteworthy that the measurement of χ(2,1)(ω) is particularly well suited, as it does not induce a heating effect by an intense oscillating electric field. Finally, the modulus of these third-order terms has a characteristic local maximum, whose amplitude increases during cooling, which is considered a signature of correlations in the diffusion motion.
In order to clarify this link, the SPEC team proposed to use molecular dynamics simulations for glycerol, a system that has been extensively studied experimentally, the results of which are published in Physical Review Letters. The size of the studied system is 2160 glycerol molecules. The simulations enable the extraction of both the third-order susceptibility χ(2,1)(ω) and the spatio-temporal correlations from the differences in the fluctuations in molecular orientation in the presence and absence of a strong static field. These quantities can be directly linked to experimental measurements of the same difference (with or without a static field) in linear response to the application of a weak oscillating field.
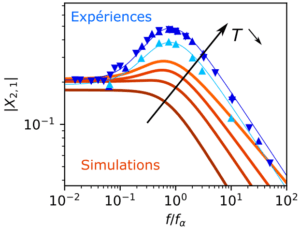
Simulations show that the χ(2,1)(ω) module clearly exhibits a maximum whose amplitude increases as the temperature decreases (see Fig. 1a). While the experiments are mainly carried out at temperatures close to the glass transition, where relaxation times are between 1 ms and 1 s, the simulations only allow us to study the “high temperature” regime, in which the dynamics are very fast (1 ps to 100 ns). Despite this, it is observed that the simulations complement very well the experimental measurements at lower temperatures (see Fig. 2a). In particular, they reveal the high temperature maximum at the onset of the slowdown in dynamics, i.e., at the temperature where the activation energy of diffusion Ea(T) begins to depend on T.
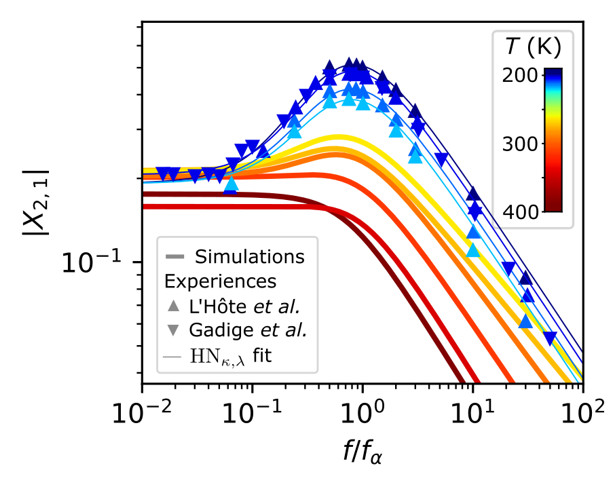
Fig. 1: Spectrum of the third-order electrical susceptibility moduluse, χ(2,1)(ω), of glycerol at high temperature (red and yellow curves from simulations) and at low temperature (blue curves from experimental data, in the presence of a static field and a weak alternating field with frequency f = 2π/ω). The appearance of a maximum at the threshold is clearly shown.
The interpretation of dielectric spectra (linear or not) is complex due to the orientational correlations resulting from dipole interactions. These dipole correlations are different in nature from the dynamic correlations resulting from all interactions between molecules. The former exist at all temperatures, have a static component, and depend heavily on the nature of the liquid, while the latter only appear at low temperatures and are potentially universal. Numerical simulations allow to differentiate between the two types of correlations. In the case of glycerol, it can be checked that, although the effect of dipole correlations contributes significantly to the linear response, it has only a minor effect on the evolution of the maximum of the modulus of χ(2,1)(ω).
The results of the simulations allow a direct characterization of the dynamic correlations by comparing diffusion events at different points in space. During cooling, an increase in the average number of dynamically correlated molecules is observed, as shown by the curve described by the green stars in Fig. 2b. It has been checked that this enhancement aligns with the experimentally measured ratio of activation energy to thermal energy, Ea(T)/kT. This ratio can therefore be considered as an experimentally accessible estimate of the number of dynamically correlated molecules.
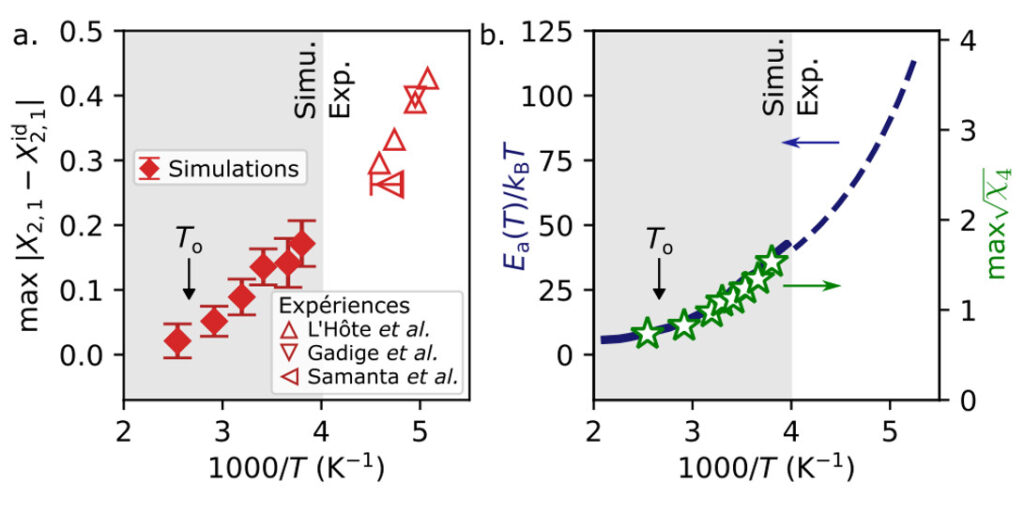
Fig. 2: (a) Evolution of the amplitude of the maximum of the χ(2,1)(ω) modulus as a function of the inverse of temperature. (b) Similarly, evolution of the average number of dynamically correlated molecules obtained by simulation (as obtained from the maximum of (𝜒4)1/2, green stars) or estimated by the ratio of activation energy to thermal energy (solid blue curve for simulation data and dashed curve for experimental measurements). For these two quantities, the curves resulting from the simulations and the experiment are in line with each other.
These molecular dynamics simulations thus validate previous experimental data obtained by non-linear dielectric spectroscopy. The over-dynamicization associated with the increase in activation energy and the increase in the size of the number of molecules dynamically correlated with the drop in temperature are clearly confirmed. They provide a better understanding of the role of cooperative motions in slowing down liquid dynamics as the glass transition approaches.
These molecular dynamics simulations validate previous experimental data obtained by nonlinear dielectric spectroscopy. The slowing down of dynamics, associated with an increase in activation energy and an increase in the number of dynamically correlated molecules as the temperature decreases, is clearly confirmed. These simulations provide a better understanding of the role of cooperative movements in slowing down the dynamics of liquids as the glass transition is approached.
Reference:
Emergence of a Hump in the Cubic Dielectric Response of Glycerol,
M Hénot, F Ladieu, Physical Review Letters 134 (21), 218202 (2025) – arxiv:2410.00867:
See previous highlights:
- “The glass transition: highlighting its critical character using nonlinear response measurements” (2017)
- “First evidence of the transition to amorphous order in glasses” (2016)
- “Glass transition: cooperative effects and dynamic length” (2005).
CEA contact: Marceau Hénot and François Ladieu, SPEC/SPHYNX.