
Laboratoire Léon Brillouin
UMR12 CEA-CNRS, Bât. 563 CEA Saclay
91191 Gif sur Yvette Cedex, France
+33-169085241 llb-sec@cea.fr
Laboratoire Léon Brillouin
UMR12 CEA-CNRS, Bât. 563 CEA Saclay
91191 Gif sur Yvette Cedex, France
+33-169085241 llb-sec@cea.fr


Progression of a stress corrosion crack in pure silica. The mean crack velocity measured at the micrometer scale was 30 pm/s
Cindy Lynn ROUNTREE, Silke PRADES, Daniel BONAMY, Davy DALMAS, Claude GUILLOT, Elisabeth BOUCHAUD
Coll. with Rajiv KALIA (University of Southern California, Los Angeles, USA)
Fracture of pure silica, a “minimal” elastic material has been explored both experimentally and through numerical simulations. In both cases, the crack was shown to progress through the growth and coalescence of damage cavities ahead of the front. This mechanism was shown to be responsible for small scales non linear elastic behaviour both for ultraslow stress corrosion and dynamic fracture.
1.2.1. – Fracture mechanism
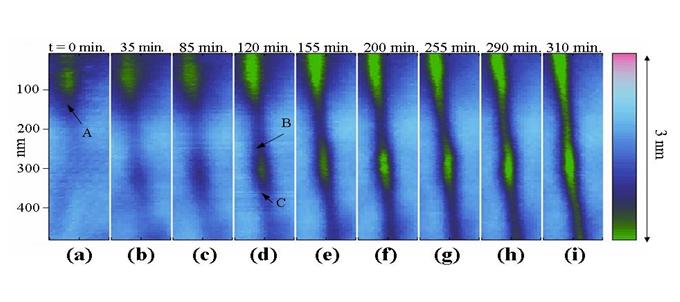
Stress corrosion ultraslow (average crack velocity ranging from 1 to 100 pm/s) mode I cracks in pure amorphous silica were followed with an Atomic Force Microscope (AFM) /1/, revealing the nucleation, growth and coalescence of damage cavities (see Fig. 1).
In order to investigate the precise dynamics of crack propagation, we plotted the spatio-temporal diagram showing the evolution of the various fronts: main crack front (A in Fig. 1), rear- and fore-fronts of the cavity (respectively B and C in Fig. 1). These trajectories are shown in Fig. 2. From this plot, one could measure the mean velocities of the various fronts: VA≈3 pm/s, VC≈8 pm/s and VB≈9 pm/s for the main crack tip, the forward front and the backward front of the cavity respectively. All these velocities, including VA, are significantly smaller than the crack tip velocity measured at the continuous scale, 30 pm/s.
As a matter of fact, at these small scales, the crack front does not propagate regularly, and the largest contribution to the crack velocity is due to its merging with the cavities.
Molecular Dynamics (MD) simulations of mode I dynamic fracture were also performed on an amorphous silica specimen of size (120.6 nm)3 composed of 110 million atoms. Three mean crack growth velocity regimes were observed, at 10, 300 and 1300 m/s. Although at much smaller scales than in the experiment, the same mechanism involving the nucleation, growth and coalescence of damage cavities was observed. It was also shown to be at the origin of a departure from linear elasticity observed in the vicinity of the crack tip.
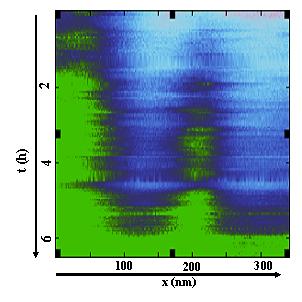
Spatio-temporal diagram showing the trajectories of fronts A,B and C.
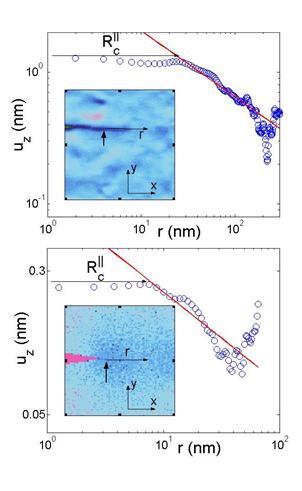
Top experiment, mean crack speed 0.15 nm/s; Bottom simulation, 300 m/s. Both insets show the topography of the sample surface near the crack tip (thick black arrow).
Main figures show the variation of the vertical displacement with r on logarithmic scales.
Blue circles correspond to measured data while the red line corresponds to 1/r1/2 . The experimental and numerical profiles depart from this scaling at distances r from the crack tip smaller than 100 nm and 10nm, respectively.
1.2.2. – Departure from linear elasticity
The process zone was determined both in experiments and simulations /2/. In an elastic medium, the stress field exhibits a square root singularity at the crack tip. As long as the linear elastic stress/strain relation remains valid, one expects also a square root singularity in the components of the strain tensor, and in the out-of-plane displacement at the free surface. We have compared the surface topography in the vicinity of the crack tip as observed both in experiments and in simulations to this prediction. Fig.3 presents a height profile taken along the direction of crack propagation. Far from the crack tip, this profile is well fitted by the 1/r1/2 law. But the experimental profile departs from this scaling below a given value Rc, which sets the length of the process zone. This value was observed to be of a few hundreds of nanometers in stress corrosion, and significantly smaller, a few tens of nanometers, in dynamic fracture. As a matter of fact, Rc decreases with the average crack speed.
REFERENCES:
[1] S. Prades, D. Bonamy, D. Dalmas, E. Bouchaud, C. Guillot., Int. J. of Solids and Structures 42, 637 (2005)
[2] D. Bonamy, S. Prades, C.L. Rountree, L. Ponson, D. Dalmas, E. Bouchaud, K. Ravi-Chandar, C. Guillot, Int. J. of Fracture 140, 3 (2006)
[3] C.L. Rountree, R.K. Kalia, E. Lidorikis, A. Nakano, L. Van Brutzel, P. Vashishta, Annu. Rev. Mater. Res. 32, 377 (2002)
• ![]() Systèmes complexes et transition énergétique › Statistical physics in mechanics
Systèmes complexes et transition énergétique › Statistical physics in mechanics
• Laboratory of Physics and Chemistry of Surfaces and Interfaces • UMR 3680 - Service de Physique de l'Etat Condensé (SPEC) • Service de Physique et Chimie des Surfaces et des Interfaces
• Laboratory of Nano-Objects and Complex Systems (LNOSC) • SPHYNX • GMT-MSIN : Modélisation des Surfaces Interfaces et Nanostructures
![]() PHoCEA DRF 2024 - Tous droits réservés - Mentions légales - Ce site utilise Bootstrap
PHoCEA DRF 2024 - Tous droits réservés - Mentions légales - Ce site utilise Bootstrap
Dernière mise à jour : 28-06-2024
